I finally finished the script for the exhibition space we have designed where we suspend 3024 mason jar lids from a T-bar ceiling. In order to streamline the process, I used the Grasshopper plug-in to parametrically control several aspects of the design. Below, I try to explain each step of the process and how the script works. This script is much more detailed than the previous version, as now all of the steps are embedded into 2 scripts: one grasshopper definition which deals with all of the math behind the project, and one rhinoscript that deals with exporting the data to Microsoft Excel for easy access.
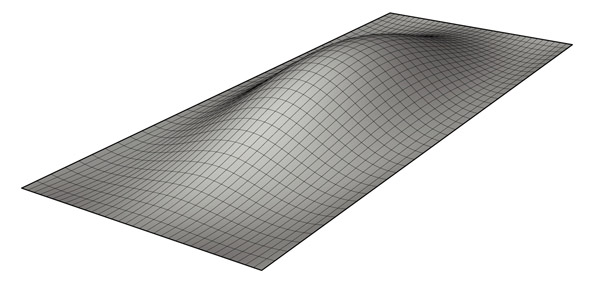
Step 1: The script needs a surface that is larger than the point grid area in order to function properly, so the first step is to generate a sufrace using any of Rhino's surface creation methods. This is the only step that is required prior to launching Grasshopper and running the definition. Click image for more detail.

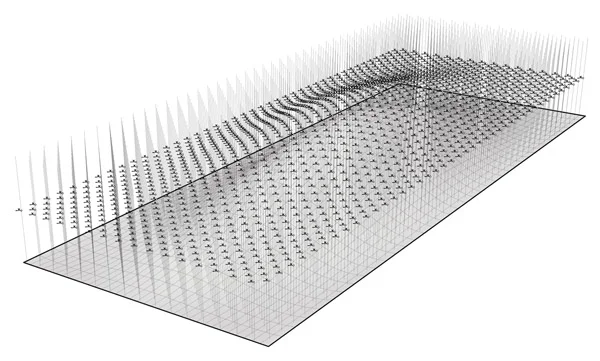
Step 2: The first part of the definition creates a staggered point grid based on a variable offset distance (inches) which is parametrically driven by an integer slider labeled "point spacing". It is important that the point grid is created above the surface (z-axis). Click image for more detail.

Step 3: The next part of the definition duplicates the staggered point grid created in Step 2 and moves them along the z-axis so that the copies are below the given surface. Next, a vertical line is created between the original point grid and the duplicates. Click image for more detail.

Step 4: The definition uses a surface-curve intersection event to create a new point at the location where the vertical lines created in Step 3 intersect the surface. A new line is then created from the new intersection points and the original point grid created in Step 2. Click image for more detail.
Step 5: The script then uses a few components and functions to create a label that defines what panel the vertical line will be attached to, what lid will be attached to the vertical line, and the length of each line. A text tag is placed at the midpoint of each line similar to: "Panel1_Lid1 72.000". The distance is measured in inches and rounds the length of the line to the nearest one thousandth. All text tags must be baked into the scene in order to export the data to excel. (special thanks to Troy Zezula for collaborating on this part of the script). Click image for more detail.

Step 6: Once all of the text tags have been baked into the scene, use the "Load Script" command and locate the rhinoscript called "Export_curvedata_excel.rvb". The use the "Run Script" command and select the loaded rhinoscript from the menu. Follow the on screen directions in the command prompt and select all of the text tags. Excel will automatically open, and a new file will be created with the panel labels and lengths organized for easy access. Within Excel you can convert the length stored from Rhino (rounded to the nearest one thousandth) into a more managable dimension using feet and inches and a specified tolerance. Click image for more detail.